When talking about Nornir and Ansible, speed is one of the topics that come up from time to time. A common argument for Nornir is that it performs better when working with either many hosts or lots of data. For some who hear this, it isn’t entirely clear what we mean. This article will look at some numbers. Recently I came across a quote by Kelsey Hightower that stuck with me.
“You haven’t mastered a tool until you understand when it should not be used.”
Let’s see if any of that can be applied here.
A few years ago, I tended to solve a lot of my problems with Ansible. As the tool could work with several devices in parallel, it fits with a lot of the things I needed to solve. One day a client asked me to collect data from some IOS XR devices. They needed to create a graph of some information that they couldn’t access using SNMP. At the time when we did this, the only way to collect the data was by issuing show commands through the CLI and parsing the information.
The output from the “show dhcp ipv4 proxy binding” command looked like this:
                                        Lease
 MAC Address    IP Address     State    Remaining  Interface           VRF      Sublabel
-------------- -------------- --------- --------- ------------------- --------- ----------
2cb0.5d00.000a 10.248.159.182 BOUND      8691     BE1.201             default   0x11664
20d5.bf00.000b 10.48.93.39    BOUND      10315    BE1.1530            cust-a    0x1853b
a4b1.e900.000c 10.200.185.166 BOUND      10617    BE1.1502            default   0x1cf76
3091.8f00.000d 10.200.185.165 DELETING   N/A      BE1.1526            default   0x10606
0006.1900.000e 10.184.88.53   OFFER_SENT 27       BE1.1534            cust-b    0xa98d
0026.f200.000f 10.200.185.170 BOUND      10794    BE1.1546            default   0x1bb34
0006.1900.0010 10.184.88.24   OFFER_SENT 54       BE1.1535            cust-b    0x44d0
0002.9b00.0011 10.48.90.0     BOUND      10796    BE1.1543            cust-a    0x1c5cc
For each device we needed to count the number of subscribers in each VRF. So, for this sample output, we would have two subscribers in the BOUND state in the VRF called cust-a. As this was a few years ago I don’t remember the exact numbers but I think there were about 90 of these devices and the number of subscribers in various VRFs could range from 1000 - 30 000 per device.
I created an ntc-template and my idea was to collect the data with an Ansible playbook that parsed the data, then sent it into InfluxDB so that it could be visualized using Grafana. The exact timestamps wouldn’t matter that much since the goal was just to see how many customers should normally be BOUND to each VRF and if there was an issue the on-call staff would be able to see if a current situation was normal or not. For that reason, I just normalized the timestamp and scheduled the Ansible playbook to run every five minutes. After the first run, it all fell apart as it turned out that the playbook wasn’t able to finish within five minutes.
At that time Nornir didn’t exist and to solve the problem at hand I wrote my own tool to collect the data. For an example of what such a tool could look like today, you can find some inspiration here
One could argue that I was stupid all along. Of course, Ansible isn’t the correct tool to gather data. On the other hand, when working with network equipment even just for config tasks I found myself often using the register option in an Ansible playbook to store some variable state from network devices.
A scenario that is perhaps more common is to generate configuration from templates for network devices. I decided to compare how Ansible compares to Nornir for this task and how the inventory size impacts the speed. The inventory was one I generated using the Faker library, you can find the script for this in the code section.
The templates used were very basic, the one for Ansible looked like this:
OS: {{ os }}
Management: {{ mgmt_v4 }} {{ subnet_mask }}
While this is the one for Nornir:
OS: {{ host.platform }}
Management: {{ host.mgmt_v4 }} {{ host.subnet_mask }}
The Ansible playbook is also very simple:
---
- hosts: all
  connection: local
  gather_facts: no
  tasks:
    - name: Generate template
      template:
        src: "ansible-base.j2"
        dest: "output/ansible/{{ inventory_hostname }}.cfg"
The first test was using an inventory with 1000 devices. When starting the Ansible Playbook on my Macbook Pro, it was as if it just started a session of high intensive training, a few seconds in the internal fans are giving their all. The playbook ran for several minutes.
To do the same within Nornir the code looks like this:
import sys

from nornir import InitNornir
from nornir.plugins.tasks import files, text
from nornir.plugins.functions.text import print_result


def generate(task):
    template = task.run(
        task=text.template_file,
        name="Render",
        template="nornir-base.j2",
        path="templates",
    )
    task.run(
        task=files.write_file,
        name="Write",
        filename=f"output/nornir/{task.host}.cfg",
        content=template.result,
    )


def main(inventory_size):
    nornir = InitNornir(
        inventory={"options": {"host_file": f"nornir-inventory-{inventory_size}.yaml"}},
        dry_run=False
    )
    result = nornir.run(task=generate)
    print_result(result)


if __name__ == "__main__":
    inventory_size = int(sys.argv[1])
    main(inventory_size)
Nornir completed this task in just over two seconds. As I was running this on my laptop both of these examples, of course, had to compete with other processes that were running such as Spotify and whatnot. In order to make the comparison a bit fairer, I set up a machine at DigitalOcean with dedicated CPUs and ran a few more tests there.
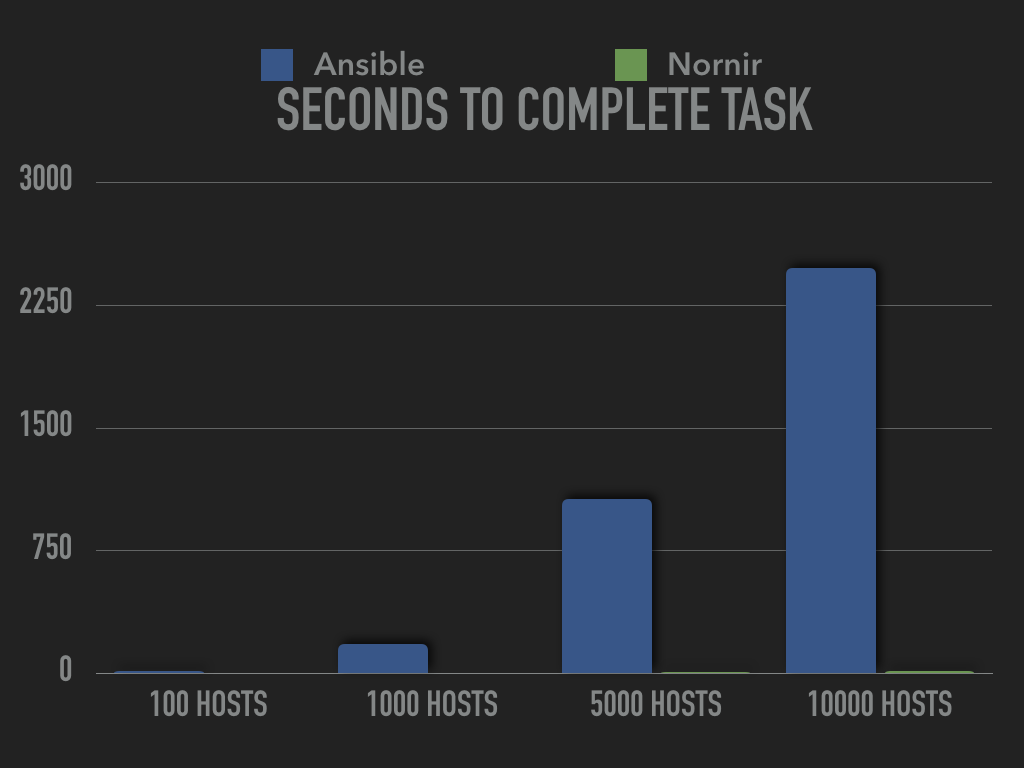
I generated different sized inventories based on 100, 1000, 5000 and 10000 hosts and then looked at how many seconds it took to run the tasks using Ansible or Nornir.
It should also be noted that all of this happens without touching the network, it’s just the time it takes to prepare the data before going out to the network. You will however see the same behavior when gathering data or facts from the network.
To test this I setup a General Purpose Droplet at DigitalOcean with 8 GB of RAM and 2 CPUs. The system was running Debian 10 with Python 3.7.3, Ansible 2.9.0 and Nornir 2.3.0.
I ran the tests with four different inventory sizes.
time ansible-playbook -i ansible-inventory-100.yaml ansible-run.yaml
real    0m18.217s
user    0m26.760s
sys    0m8.380s

time ansible-playbook -i ansible-inventory-1000.yaml ansible-run.yaml
real    3m1.560s
user    4m29.763s
sys    1m28.898s

time ansible-playbook -i ansible-inventory-5000.yaml ansible-run.yaml
real    17m47.708s
user    23m44.082s
sys    11m30.803s

time ansible-playbook -i ansible-inventory-10000.yaml ansible-run.yaml
real    41m22.106s
user    47m53.756s
sys    34m6.729s

time python3 nornir-run.py 100
real    0m0.621s
user    0m0.438s
sys    0m0.072s

time python3 nornir-run.py 1000
real    0m2.005s
user    0m1.630s
sys    0m0.353s

time python3 nornir-run.py 5000
real    0m8.906s
user    0m7.321s
sys    0m1.662s

time python3 nornir-run.py 10000
real    0m17.217s
user    0m15.033s
sys    0m3.345s
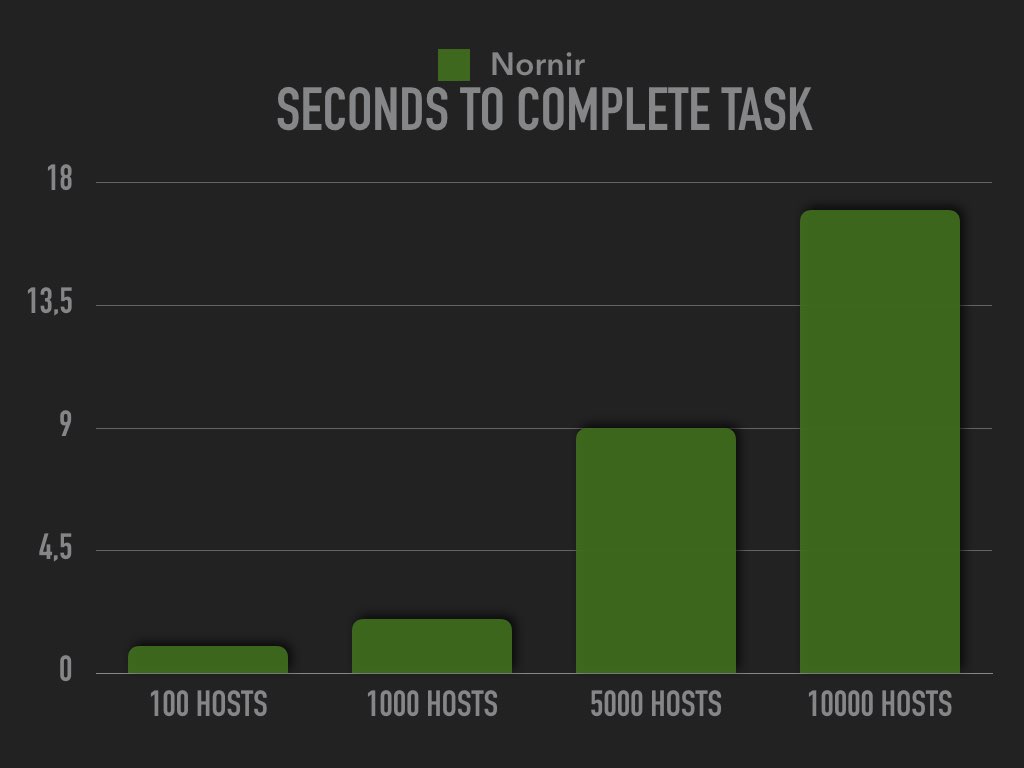
I could have done more tests with larger inventories too, but I was paying by the hour. One thing to highlight here is that whe you add twice as many hosts to the Nornir run it more or less doubles in time. Using Ansible doubling the amount of hosts or data will more than double the time.
Looking at the above output in a diagram is very telling.
 It may appear that the data for Nornir is missing in the first two tests, it just looks that way because the bar would be so small. Even the other bars are hard to see. It’s easier if we remove the data for the Ansible tests.

When running the tests I used the default forks in Ansible and num_workers, however for this scenario / problem it doesn’t really matter since all of the processing of the data is done on the host regardless if it’s Nornir or Ansible being used.
The above is just an easy to illustrate an example, remember I hit a ceiling when using around 90 devices and the issue there was the amount of data. The main problem seems to be that Ansible is serializing and deserializing JSON data between every task and internally within the core, at some point this becomes problematic.
It could be that you are collecting some facts from the network and want to use those facts later on in the Ansible playbook.
This, of course, depends on your situation. In some scenarios, it could be absolutely critical. A lot of time it doesn’t matter that much, especially when we are talking about background tasks. A big pain point for me is if I have to wait for a computer to complete something, I always try to minimize that time. Having said that I wouldn’t say that speed would be my main argument for using Nornir. Likewise, there’re a lot of scenarios with Ansible where the numbers above are completely irrelevant.
I hope that I’ve shed some light on the discussion about speed when working with data within Ansible or Nornir. Again the findings here might not be relevant for your situation, but it’s something to keep in mind. If you want to take a look at the code used in this article look at the networklore-demos repository within the python/nornir/ansible-nornir-speed directory.